Outcomes, not activity
Tie every shipped feature to a measurable business result so board updates report impact instead of commit counts and story points.
For Engineering Leaders
Connect delivery speed, quality, rework, and AI-assisted output in one view so investment decisions rest on evidence instead of activity counts.
Start with one repository. Keep your tools, workflow, and code ownership.
What you will see
Start with one repository and turn existing delivery history into evidence about speed, quality, and AI return before you commit to a broader rollout.
Tie every shipped feature to a measurable business result so board updates report impact instead of commit counts and story points.
A single dashboard that rolls delivery, quality, and outcome signals up from PR to portfolio without spreadsheet archaeology.
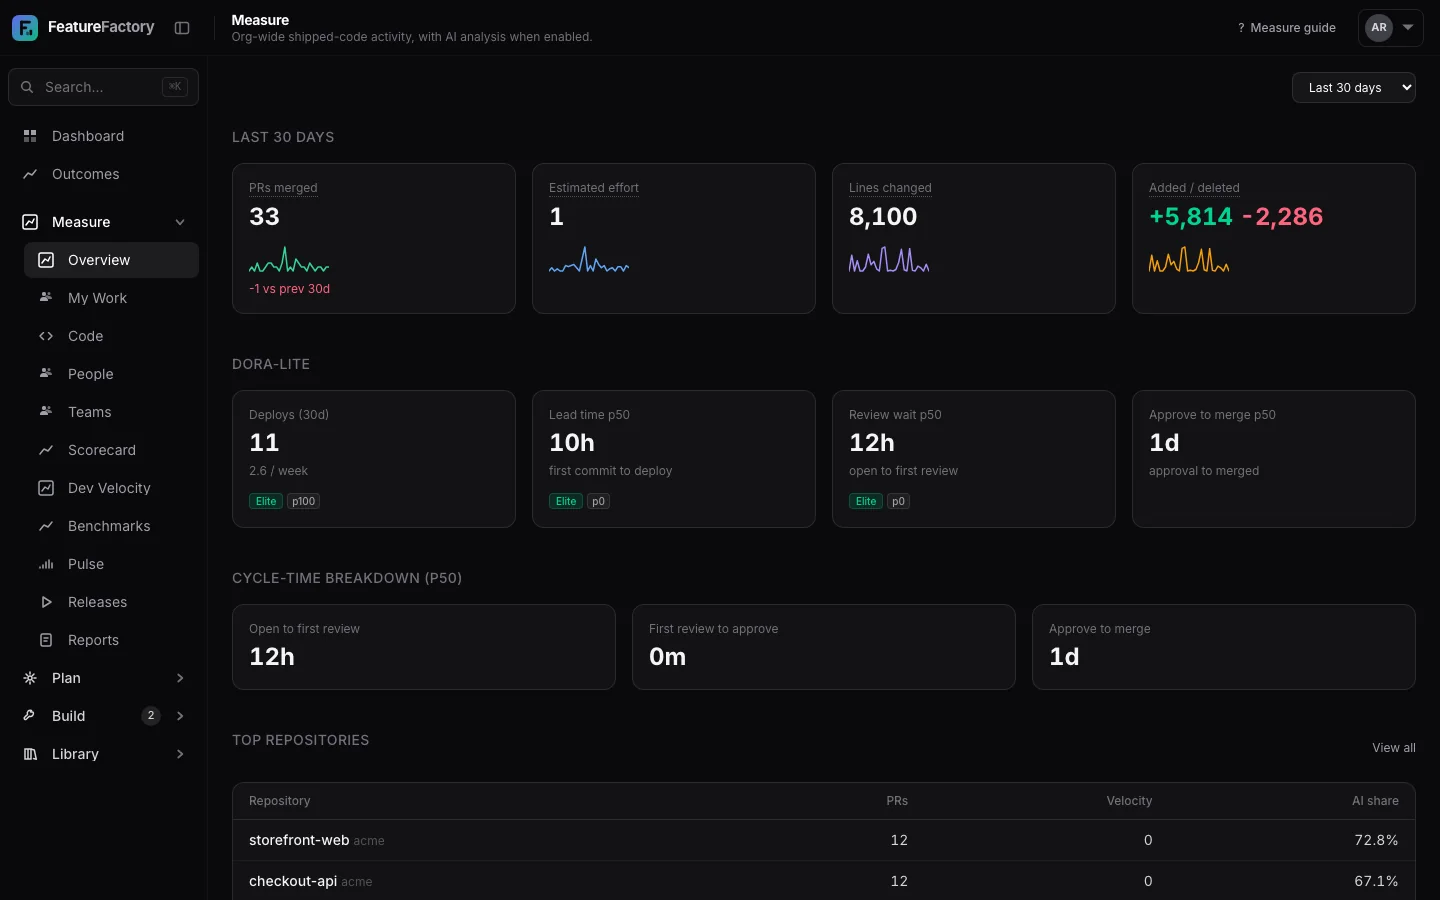
Track lead time, deploy frequency, change-fail rate, and cycle time as trends, not one-off screenshots pulled the night before a review.
Inside FeatureFactory
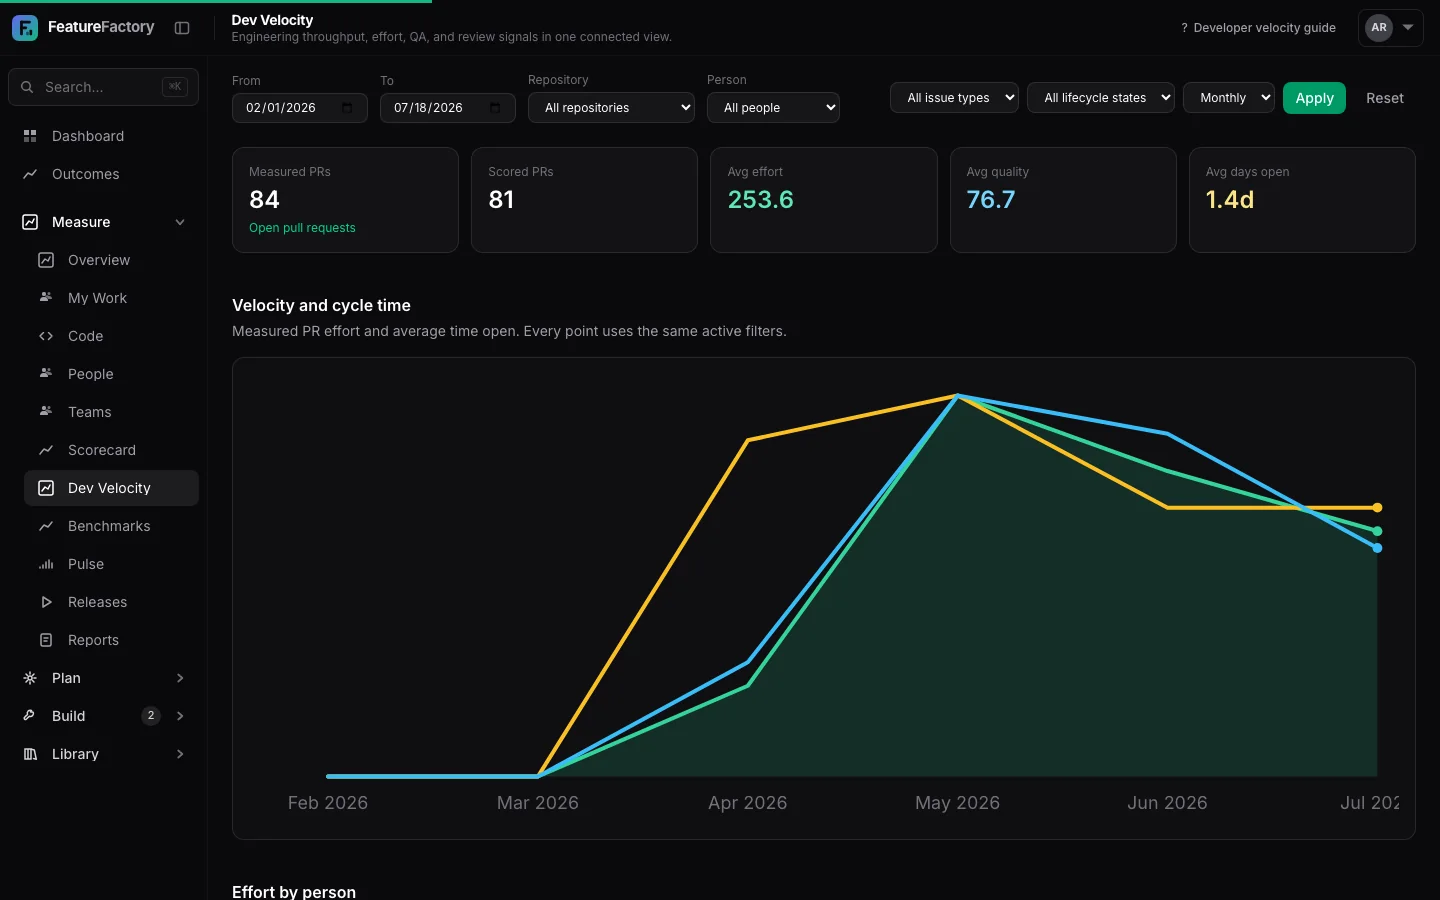
Representative product data shows the workflow in context. Open a view at full size to inspect its details.
Built for your operating questions
Tie every shipped feature to a measurable business result so board updates report impact instead of commit counts and story points.
A single dashboard that rolls delivery, quality, and outcome signals up from PR to portfolio without spreadsheet archaeology.
Track lead time, deploy frequency, change-fail rate, and cycle time as trends, not one-off screenshots pulled the night before a review.
See what your agents and copilots actually shipped, how much survived review, and whether the merged code moved the metric.
Walk into budget and headcount conversations with a defensible line from engineering spend to delivered, owned business value.
Aggregate signals across teams and initiatives so you can compare bets, reallocate capacity, and kill work that is not paying off.
From repo to baseline
Use read-only access and select the exact repository you want to evaluate. Your team keeps working as usual.
FeatureFactory reads existing pull request and commit history to establish cycle time, quality, rework, and AI contribution signals.
Review an evidence-backed baseline, then decide where to improve flow, quality, or AI adoption before expanding the rollout.
Developer velocity
Developer velocity should explain how reliably engineering turns investment into durable change. FeatureFactory accounts for complexity, review depth, and rework so a surge in output is not mistaken for progress.
Explore developer velocityEngineering leaders live at a translation layer. Above you, the business asks a simple question: what did we get for the spend? Below you, the honest answer is buried in commits, tickets, and deploy logs that mean nothing to a CFO. Most dashboards make this worse by handing you more activity metrics to defend.
FeatureFactory inverts that. Every initiative is mapped to the outcome it was meant to move, and delivery signals roll up as evidence for that outcome rather than a wall of throughput charts. When someone asks whether the last quarter of engineering paid off, you answer with a line from spend to shipped, owned value - see how the measurement layer assembles it.
The result is a review deck you can trust because it was never hand-assembled. Trends are continuous, sourced from your real DORA and cycle-time history, and defensible when someone pushes back.
Your teams are shipping with agents and copilots, and your leadership wants to know if it is working. Activity metrics cannot answer that - they count PRs whether a human, a copilot, or an agent wrote them, and they say nothing about whether that code survived review or moved a number.
FeatureFactory attributes merged code to its source and tracks how much AI-generated work actually lands and holds up. Pair that with outcome mapping and you can finally state, with evidence, whether your AI investment is producing value or just volume. Start with measuring AI-generated code and the broader productivity platform.
That accountability is what separates a real engineering-intelligence practice from a screenshot pulled before a board meeting. It is developer-led, transparent, and the code stays yours.
Analyze one repository free and see whether delivery speed is holding up under review, rework, and AI-assisted change.
Analyze one repo freeOne repository. No credit card. Read-only access.